As you already know per my investing strategy, I’m not a big fan of high dividend yield stocks. At DSR, we even penalize stocks paying over 5% for our Rock Solid Ranking. After sending one of my newsletters, a reader answered me back telling me, once again, that I wasn’t picking stocks with high dividend yields. In other words; stocks I write about don’t generate enough payout to interest him.
As I’m a very curious investor and open to new ideas, I asked him to provide me with some of his latest good picks to see how his portfolio is going. When I send him this email, I also added to be very careful with high dividend yield stocks as they are riskier than regular stocks. After all, there is a reason why a company pays a 6%+ dividend distribution and it’s not because management is generous. Willy Wonka hasn’t taken over any company yet!
The reader kindly answered back with four selections:
Kinder Morgan Energy (NYSE: KMP) 6.66% dividend yield
BreitBurn Energy Parnters L.P. (NASDAW: BBEP) 8.81% dividend yield
Starwood Property Trust (NYSE:STWD) 8.10% dividend yield
Ares Capital Corporation (NASDAQ: ARCC) 8.91% dividend yield
For argument’s sake, I will pretend he owns only those four companies and invested $25,000 in each of them. I will do the same with four of my own selections and build a 100K portfolio with the same proportions. I will analyze each stock individually and compare both portfolios over a 1 year and 5 year periods. We will see how both portfolios go.
Please note the reader mentioned he never holds more than 5% of his portfolio in any of his stocks and that he follows his holdings carefully. I believe he is an experienced investor and knows what he is doing.
Portfolio #1 High Dividend Yield Approach
Portfolio #1 shows an average dividend yield of 8.12%, this is a very impressive payout distribution yield. Technically, 100K invested in this portfolio will then generate over $8,000 per year. From a retiree’s perspective, earning $8k per 100K invested is the jackpot. For someone with 500K invested in the market, he could technically live off his dividends and barely touch his capital. That’s the perfect scenario.
Now, let’s check what happened if you had put 100K 1 year ago in these four stocks:
[table id=23 /]
As I mentioned, today’s portfolio dividend yield is slightly over 8%. It seems that over the past 12 months, three stocks show a negative value and compensated with a high distribution. The portfolio shows a total return of 11.87% including dividend. This is mainly thx to BreitBurn Energy Partners who show an amazing +38.70%. The other three stocks didn’t do much. In comparison, the S&P 500 went up by 17.33% not counting dividend during the same period. Still, it’s not a bad investment.
The results are far more surprising when you look at a five year period:
[table id=24 /]
The portfolio outperformed the S&P 500 with a return of 154.63%. Besides Starwood Property (+58%), the other three companies performed very well. I’ll give you a scoop right away; the high dividend yield portfolio even beat my “DSR four stocks portfolio”. Does it mean it’s a better of way of investing? I’ll let you continue your reading to see what these four companies are and which ones I picked to make a comparison.
Kinder Morgan Energy (NYSE: KMP)
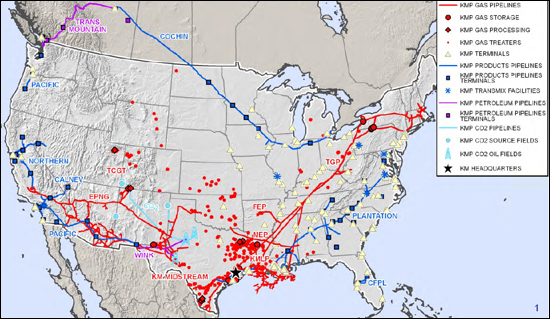
Kinder Morgan Energy Partners, L.P. is a pipeline transportation and energy storage company in North America, which owns and manages a portfolio of energy transportation and storage assets. KMP owns interest in 80,000 miles of pipelines and 180 terminals. KMP is owned by Kinder Morgan Inc. (KMI). Kinder Morgan is the largest midstream and the fourth largest energy company (consider four companies combined) for a total value of 100 billion.
Dividend Profile
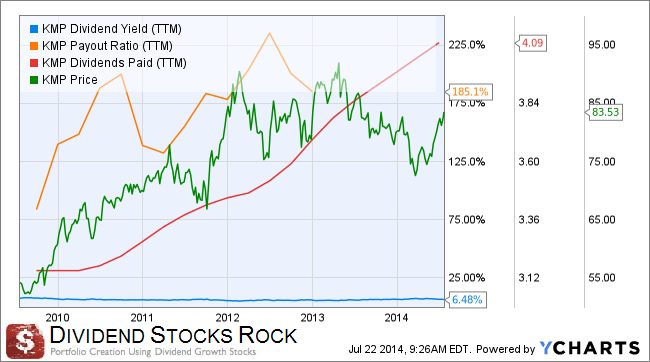
The dividend payout has increased systematically since 2010 ensuring a stable yield between 6 and 7%. The quarterly distribution went from $1.05 in 2009 to $1.38. This stock would never appear on my radar as the payout ratio is way above my standards (currently sitting at 185%). However, with pipelines, it is more interesting to look at DCF (Distributable Cash Flow) than using the EPS to calculate the payout ratio. The problem with Earnings per share is that it’s an accounting number, meaning earnings can be drop by non-real financial factors such as amortization.
If you take into consideration the past four quarters, KMP shows a 100% DCF ratio, which means it is able to distribute its dividend from its cash flow without any problems. Over the past three years, management has exceeded its dividend target. Overall, KMP shows a strong dividend profile.
General Profile
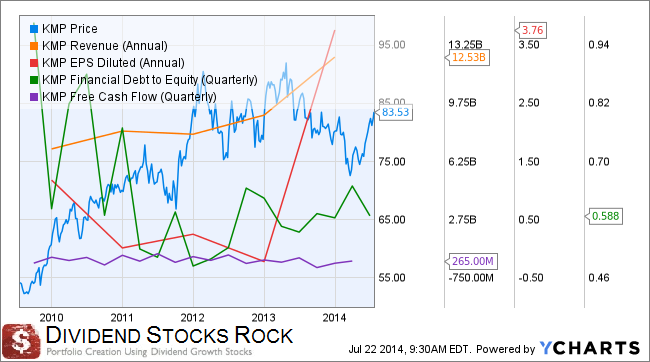
Despite its numerous acquisition and revenue increases, the company seems unable to generate additional cash flow (purple line). EPS are also a bit hectic but it lead to a great boost last year. The period from 2009 to 2014 is linked to a constantly improving economy which helps KMP as the need for both oil and natural increased. Main risks attached to such companies are the price of the resource along with future regulations. Pipelines and energy distribution is not my cup of tea but I can understand why an investor would find this stock attractive.
BreitBurn Energy Partners L.P. (NASDAW: BBEP)
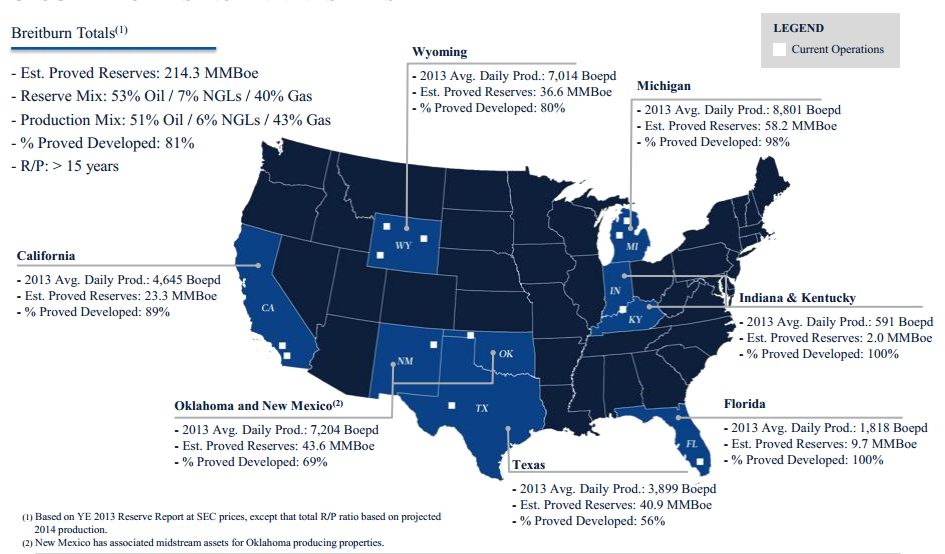
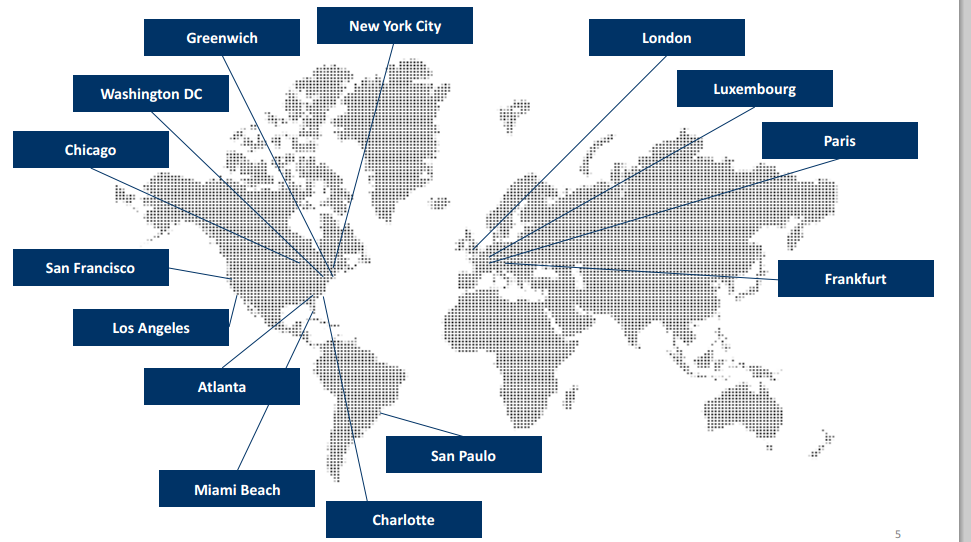
BreitBurn Energy Partners LP is a Delaware limited partnership, engaged in the acquisition, exploitation and development of oil, NGL and gas properties in the United States. Their presence is well established in nine states:
They focus greatly on distribution, which explains their very high dividend yield. BBEP recently made a major acquisition (buying rival QR Energy for 3 billion). It makes them long for oil and aims to continue its success in this segment of operation.
Dividend Profile
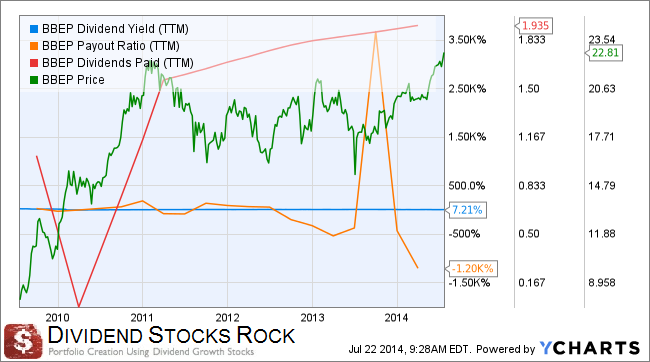
Here again, we can’t really look at MLP’s the same way we look at regular stocks. With a negative payout ratio, it’s useless to tell you that it wouldn’t fit in DSR screeners. BBEP plans on increasing its distribution through additional acquisitions. This seems a good strategy when debt is cheap and economy is on an uptrend. But when things turn sour, I’m not convinced it will be a good strategy.
General Profile
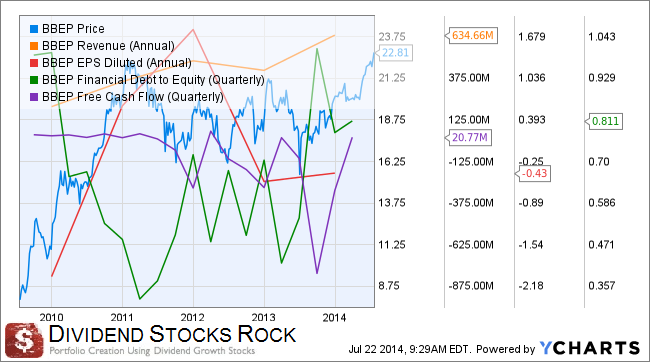
Again, we can see the limited free cash flow generated by the business which is standard for an MLP. Revenues are steadily improving as acquisitions come along the way. However, while the stock price took a big jump from 2009 to 2011, the stock hasn’t generated squat for the past three years besides its generous dividend.
Starwood Property Trust (NYSE:STWD)
Starwood Property Trust, Inc. creates, finances, manages and invests in commercial mortgage loans and other commercial real estate debt investments, commercial mortgage-backed securities, and other commercial real estate-related debt investments. Starwood is the leader in commercial REITs and operates mainly in USA:
Dividend Profile
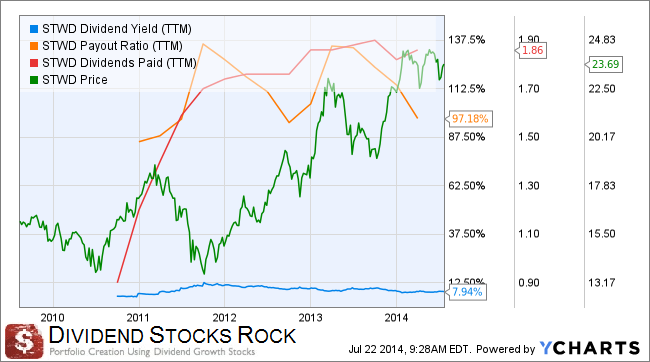
As is the case with any REIT, you can’t judge the stock with the payout ratio. Metrics like LTV (loan to value ratio) are more important to determine if the company is in good shape. Starwood averaged a 66.4% LTV since 2011, meaning 33.6% is equity in their book.
General Profile
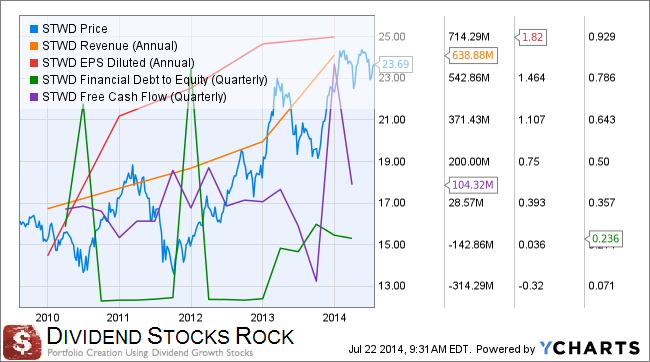
As the market picks up, STWD follows accordingly with some great volatility. But for a dividend payout seeker, it doesn’t really matter, right? Revenues and earnings are going in the right direction and the company seems to be well managed. I would have liked to see a longer track record to compare this company for a period longer than 5 years, but that’s the stock I’ve been given to comment on.
Ares Capital Corporation (NASDAQ: ARCC)
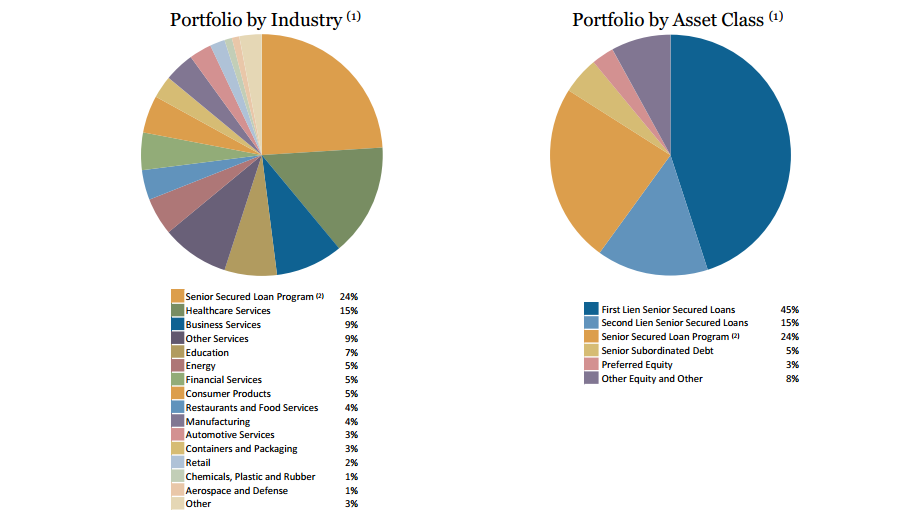
Ares Capital Corporation is a closed-end, non-diversified management investment company that primarily invests in non-syndicated senior debt, mezzanine debt and non-control equities. They are present in many industries and aim mainly for first lien debts (source):
Dividend Profile
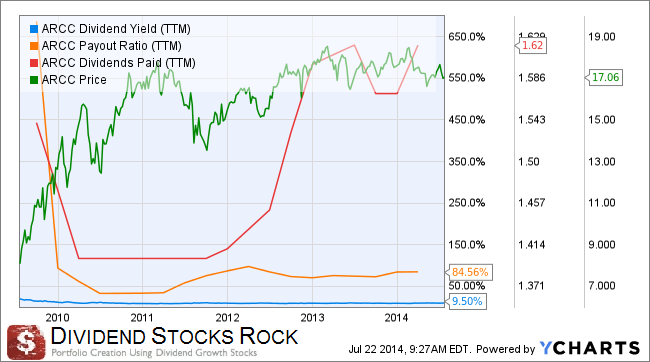
You look at the right graph; there was a dividend cut between 2009 and 2010. The quarterly payout went from $0.42/share to $0.35 and hasn’t come back yet. However, there are special $0.05 dividends paid along with a quarterly $0.38/share distribution. The payout has been stabilized around 85% after the dividend cut.
General Profile
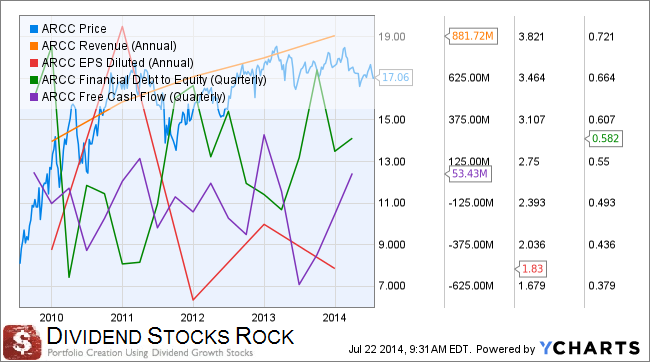
It’s hard to understand something from a graph that goes up and down like this. It just seems the company goes from good year to bad year, this is enough for me to forget about it.
Portfolio #2 Dividend Stocks Rock Approach
Here’s our DSR portfolio with four stocks coming from our website. You’ll notice that I didn’ t take our best picks and even picked Chevron (CVX) which we recently sold. The purpose was to take honest stocks that would have been picked 5 years ago according to the Dividend Stock Rocks approach.
Johnson & Johnson (NYSE:JNJ) 2.73% dividend yield
Helmerich & Payne (NYSE:HP) 2.38% dividend yield
McDonald’s (NYSE:MCD) 3.37% dividend yield
Chevron (NYSE:CVX) 3.23% dividend yield
The portfolio dividend yield in this case is only 2.93%. This is quite a difference compared to the high yield portfolio. But is the high dividend payout enough to compensate the other companies’ growth? Description of each stock are little bit shorter than the high yield because you should know about them already. but first, here are the result after 1 year and 5 years…
100K invested 1 year ago:
[table id=25 /]
If I compare the high yield portfolio to the DSR portfolio over a 12 months period, the DSR portfolio easily win by more than doubling the high yield portfolio return. As it was the case with the high yield portfolio, I must admit the return has been generated by a single company: Helmerich & Payne. I didn’t want to take only surging stocks for my comparison, this is why stocks like MCD & CVX are part of my choices instead of AAPL for example .
100K invested 5 years ago:
[table id=26 /]
I was quite surprised to see that those four stocks didn’t beat the high yield portfolio over the past five years. The high yield portfolio generated almost 20% more than the DSR portfolio. While both portfolios beat the S&P500, the DSR portfolio is not that impressive. Further down is the review of the four DSR stocks along with my conclusion comparing both portfolios.
PSST! KEEP READING, I’VE FOUND A SHOCKING CONCLUSION….
Johnson & Johnson (NYSE: JNJ)
JNJ is up almost 12% this year and have nothing but good news for investors when posting its first quarterly results. Prescription drug increases, profit jumps and a 2014 outlook increase as well. JNJ published sales increase of 3.5% and a profit jump of 8%. Both results were beyond analysts’ expectations. JNJ sales were led by international sales (+10.8%). JNJ is also working on a new diabetes drug which could push the stock to higher levels. Then, during the second quarter, JNJ continued its great job and show strong drug pipeline. They can also always rely on their consumer products as a great base for cash flow.
Dividend Profile:
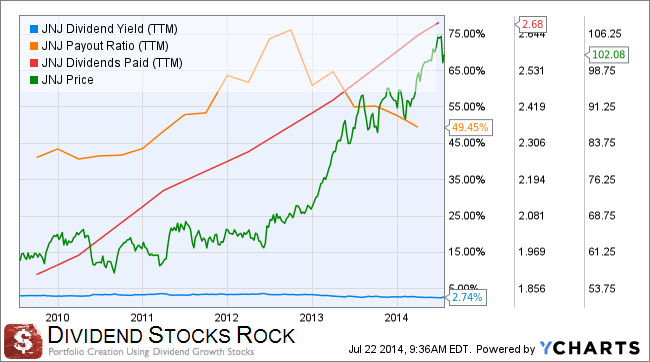
Hum… what can I say? Dividend payouts are up, payout ratio is going under 50% and the dividend remains close to 3%. Perfect dividend stock, period.
General Profile:
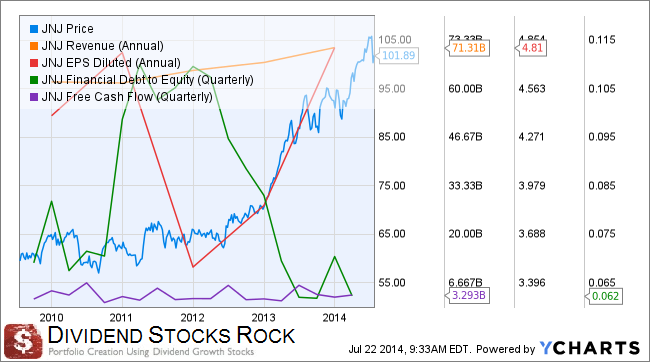
After settling their quality control problems in 2011-2012, JNJ came back stronger than ever with better than expected sales and profit. This is what shows in this graph.
Helmerich & Payne (NYSE:HP)
Not to be mistaken for the computer maker HP, Helmerich & Payne is evolving in the drilling of oil and gas wells. HP divides its business in three segments: U.S. Land, Offshore and International Land. The US land drilling is the most important part of their business with over 85% of their revenues. The urge for US energy independency has greatly helped HP over the past 5 years. The stock has surged by over 45% in 2013 and still trades at a low PE ratio. The most beautiful part of their business is probably that regardless if they find something or not down the well, they get paid! Their high level of technology is the key to remain competitive in their market.
Dividend Profile:
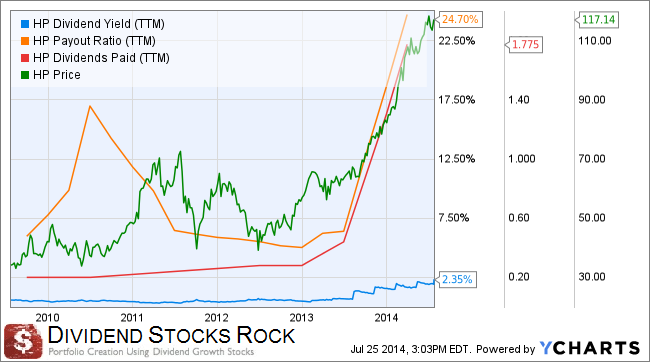
HP is the prototype of a company that was injected by a dose of adrenaline in the past two years. The stock soared along with dividend payouts. The payout ratio is still under control but the company can’t keep increasing the dividend as they did since early 2013.
General Profile:
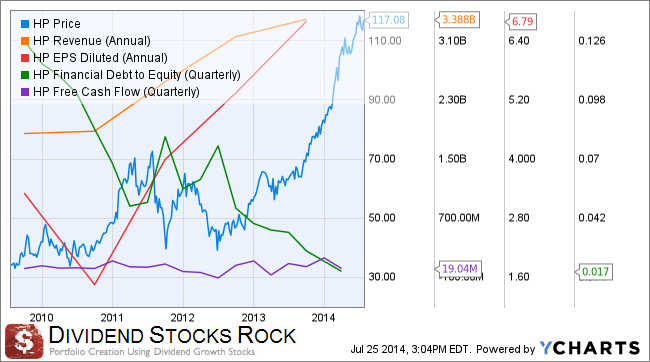
Equity has taken the entire place in this company and both earnings and revenues are on a very important uptrend. As long as the market remains bullish for oil, digging wells will be a good business.
McDonald’s (NYSE: MCD)
Ronald’s playground is not the happiest place to play these days. It’s been about 18 months now that McDonald’s has showed extreme difficulties in pushing their sales higher. YOY profits are down by 0.64%, $0.04 under estimates. Sales were up by 1.38%, but that’s not enough to convince investors MCD has the right marketing plan. Competition has been crazy lately (have you seen Chipotle Mexican Grill (CMG) results?) leading to high pressure on margins. The consumers shift to healthier food is not helping MCD in mature markets either. What’s the difference between a surge in sales of 17% for CMG and a stagnating +1% for MCD? You got it right: organic and healthier food. McDonald’s remains the leader in the fast food industry but changes in their menu urge.
Dividend Profile:
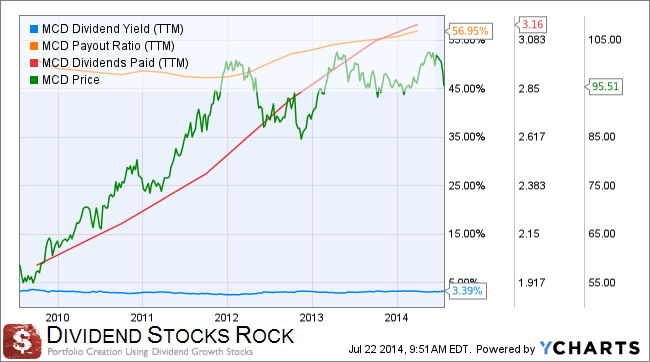
Despite not great financial results over the past 18 months, MCD has been an example in terms of dividend payer. The payout ratio is relatively stable while the dividend paid never ceases to increase.
General Profile:
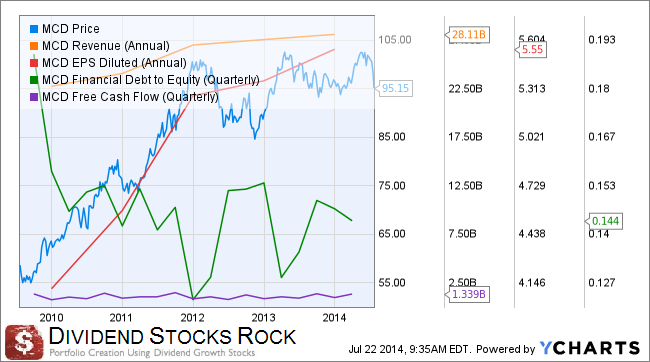
You can see the slowdown since 2012 on this graph for both revenues and earnings. However, the cash flow generated by this company is fairly stable.
Chevron Corp (NYSE: CVX)
Chevron’s recent quarter wasn’t a fairy tale. Profit fell 27% as all core business segments struggled. 95% of CVX profits come from its Exploration and Production segment and this part of the business dipped 27% as well. The stock didn’t hit the bottom of the price graph because investors keep hoping major projects are about to go into production. The recent 7% dividend increase should be enough to keep us waiting a little bit longer.
Dividend Profile:
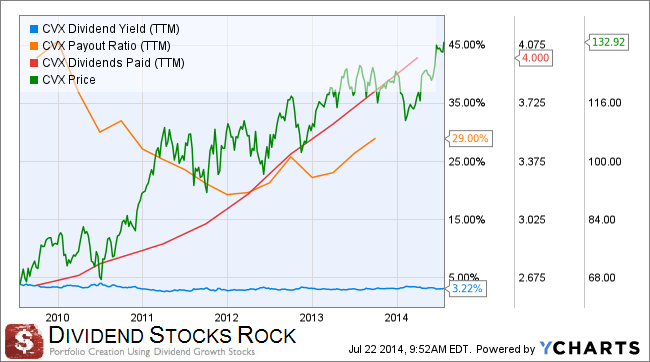
What will comfort many investors is the combination of a low payout ratio (under 30%) with a clearly increasing dividend. It is true that we have sold CVX in our portfolios not so long ago because we believe there was better opportunity, but I didn’t want to take only super winners to go against the high dividend yield portfolio. Since we are looking more at what happened in the past, I figure CVX was a great candidate to compare over the past five years.
General Profile:
Shocking Conclusion
So the High Yield Beats the DSR Model – Why is This Article Against High Yield Then?
A simple answer; look at the bigger picture. When I did a comparison between both portfolios, I took a 1 yr and 5 yr investing horizon. Considering the 5 year period is exactly the start of a great bull market, we didn’t complete a full economic circle. Check out the total return if we use the same stocks but since January 1st…2007! I didn’t even consider calculating the dividends since the capital growth is too important…. For the DSR portfolio!
High yield portfolio:
[table id=27 /]
DSR Portfolio:
[table id=28 /]
Well… 164% Vs 21%… Any Questions?
Now we see the real weakness of a high yield portfolio; it all goes well when the market is up… but it goes horribly wrong when the market goes down. While the first portfolio struggled big time and finish with a small 22% gain over seven years, the DSR portfolio surged by 164%. Don’t even think about the dividend, there is no comparison here.
Will this scenario happen in seven or ten years from now? I believe so. It’s easy to leverage on cheap money in a growing economy but it is harder to grow and increase payouts during tough years. Strong dividend growth stocks do it where high dividend yields fail lamentably. So if you think investing in high yield dividend stocks is a good thing, you must be looking at steady payouts. Don’t expect much of that if you intend to hold you stocks for more than ten years.
I think this also proves that you should always consider a full economic cycle to analyze an investing strategy, what do you think?
Disclaimer: I hold JNJ, HP and MCD in my portfolio. I sold CVX in July 2014.

