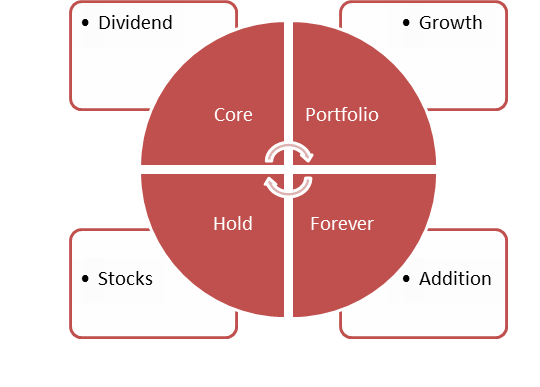
If you are going to spend money on an investing website, it’s only normal that you read about the guy behind it, right? This is why I suggest you read my about page to know more about my financial background. And if I was you, I would like to know what my dividend growth model is. Call it “investing philosophy”, “investment strategy” or “investing process”, I call it my dividend growth model. Because this is what I’m after: a long term portfolio showing strong dividend growth. It’s important to note that I don’t focus on dividend yield but rather its growth. I also consider potential stock value appreciation. This is why you will see that I sometimes deviate outside of my model to pick a stock with a lower dividend yield. This means I believe I will sell it with a healthy capital gain in a near future. For example, I’ve selected Disney (DIS) for my own portfolio paying a small dividend yield of 1% but it surged by 241% from 2009 to 2014. During the same period, DIS dividend payouts grew by 145%. This is what I call growth.
Not the Classic Dividend Growth Model You Are Used To
If you are already an experienced dividend investor, you might wonder why follow another investor with the same investing philosophy as yours. After all, buying and holding dividend stocks doesn’t sound like rocket science, right? But I’m different from the other dividend investors; this is why you should pay attention to my investing model.
I’m not an active trader and I don’t fit into the buy and hold forever type either. Most dividend investors will stick with the same stocks in their portfolio as long as they pay their dividend. This is not a bad strategy as it is the fundamental principle behind dividend growth investing: using the dividend compounding effect to boost your yield over time. But just buying and holding is too boring and there are too many opportunities on the market that I don’t want to miss.
Some stocks are good when held only for a few years. You cash the dividend while you ride the stock and sell it with a healthy profit later on. I’ve tested my theory with plays on Seagate Technology (STX), Intel (INTC), Husky (TSE:HSE). I’m currently holding Apple (AAPL) and Gluskin & Sheff (TSE:GS) based on the same principle: there are stocks providing both dividend growth and stock appreciation over a short period of time.
A part of my portfolio is the core holdings. These stocks would qualify under a regular dividend investing strategy or “buy & hold” if you prefer. When there is an opportunity, I invest 5-10% of my portfolio in a company that has great upside potential over a relatively short period of time.
The Core Portfolio Model
My core portfolio will look like that of many other dividend investors. Solid companies/Blue Chips such as Johnson & Johnson (JNJ), Coca-Cola (KO), McDonald’s (MCD) and Wal-Mart (WMT) are part of my core portfolio model. Since I’m Canadian, I’ve also added a few Canadian stocks such as ScotiaBank (BNS), National Bank (NA) and my favorite; Telus (T). The idea here is to buy stocks that I plan to hold forever. In the stock market world, this means at least five years, hahaha!
I will be more lenient on a bad financial year for these companies as long as they prove they have sufficient cash flow and increase their dividend. After all, my goal with my core portfolio is to reach a double digit dividend yield at retirement. I have roughly 30 years left prior to my retirement so this is possible if I buy the right stocks and hold them during the entire period.
In order to select stocks that will be part of my core portfolio, I use a similar filter than the one creating the DSR Premium Stock list:
- Dividend yield over 2.50%
- Dividend payout ratio under 80%
- 3yr/5yr Dividend growth positive
- 3yr/5yr EPS growth positive
- 3yr/5yr Sales growth positive
- P/E ratio under 20
The first three criteria help me look at the management’s perspective toward dividend distribution. I’m looking for companies with a reasonable payout ratio (around 50-60% is better) in order to have enough room to increase it in the future. The 5 year dividend growth stat will tell me how aggressive management is to increase its payout. I want something that will follow a similar trend as EPS and Sales growth. I’m using both 3 year and 5 year stats to make sure a huge jump didn’t happen 5 years ago and nothing has been done since then. Since I’m a dividend investor after all, I also look at a reasonable yield. I used to pick stocks with yield over 3% only but I’ve changed my approach for two reasons:
#1 The stock market has gone up very fast from 2012 to early 2014 bringing dividend yield lower
#2 If the dividend growth is strong enough, the yield will soon reach 3% based on my cost of purchase
Earnings per shares (EPS) and sales metrics will tell me more about where the company is heading. Here again, I’m looking more for steady trends than a big jump over one year. As a dividend investor, the only way I can assure that the company will continue its dividend growth policy is with bigger EPS and sales years after years. You can only manage slowing sales for so long before it really hits your net earnings. Even the best accountant won’t be able to hide a mature company without innovation for very long. After a few years of selling assets and/or cutting expenses, earnings will stagnate as sales did a few years earlier. This is why I’m looking at both metrics at the same time. Ideally, all dividend growth, EPS and sales trend would look like this company:
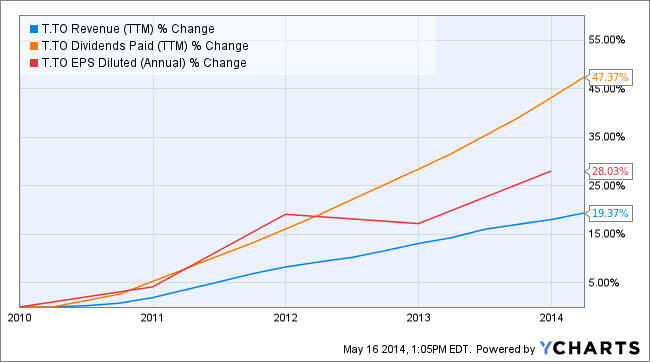
This is Telus (TU on the NYSE or T.TO on the TSE) chart. All three metrics are following pretty much the same trend.
The last metric I use is the P/E ratio to value a stock. Used on its own, it doesn’t tell much. After all, the banking industry in Canada is known to value banks at a P/E of under 14 most of the time while diversified consumer product businesses such as Procter &Gamble (PG), Johnson & Johnson (JNJ), Kimberly-Clark (KMB), Colgate-Palmolive (CL) and Clorox (CLX) are all value over 19 (over 21 for PG) nearing mid-2014. Since the average historical value of the S&P500 is around 17, I’m not too keen on buying a stock over a P/E ratio of 20. Will I keep a stock hitting a P/E ratio of 20 in my portfolio? If the reason why I bought it still stands; of course!
The Dividend Growth Stock Additions
Once my core portfolio is built, there is nothing much more to do besides read the quarterly headlines around my picks. This is where most investors stop when they apply a dividend investing philosophy. After all; why bother with other stocks when you already hold the cream of the crop?
But my aggressive trader side comes back to add a little more spice to my investing model. This is why I’ve separated my core portfolio from my dividend growth stock additions. These picks are meant to provide higher results within a short period of time. They don’t fit my “premium” stock list and shouldn’t. These companies are picked on a potential scenario that might happen. For example:
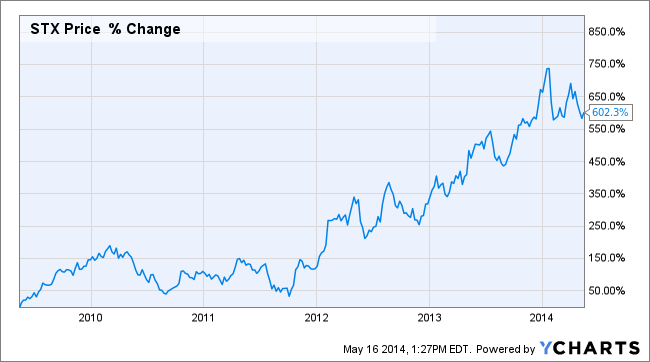
I believed Seagate Technology (STX) could come back strong from its major manufacture flood in Taiwan a few years ago. The stock was trading at a 5 P/E ratio when I bought it! Here’s what happened with the stock price over the past five years:
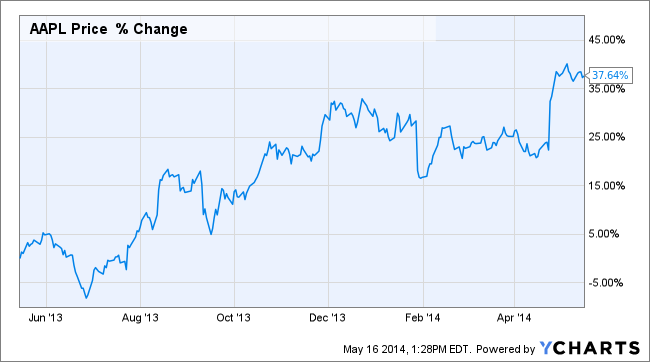
I believe Apple (AAPL) can’t go wrong with such a perfect product ecosystem, no debts and tons of cash in their bank accounts. I bought AAPL during the summer of 2013 while the “trendy investors” quit on the “inability” to recreate the growth coming from its previous innovation. Here’s how the stock react since then:
Finally, I thought all the speculation around the oil industry in Canada would benefit such a strong company like Husky (HSE). I knew the financials were a bit shaky but I counted on some hype in the future and was ready to wait since the stock was paying almost a 5% dividend based on my cost of purchase. Here’s how HSE has been since over the past two years:
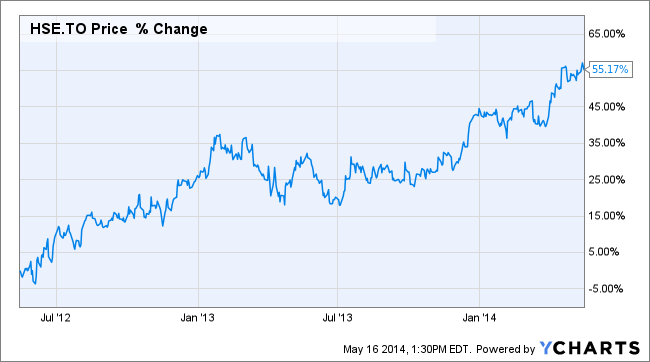
At the time of writing this article, I hold AAPL and sold both HSE and STX. I sold them for the same reason: the inability to increase their sales and the fact that I was able to cash out a healthy profit. I’m sticking to AAPL since sales are up and the dividend keeps increasing. I don’t know how long I will hold it in the future, but I know it is already a good trade.
I usually put a stop sell at one point once I feel I’ve made “enough money” from my trade. The stop sell was triggered on STX as I felt the hype for the stock was slowing down after two quarters that showed no growth. I wasn’t ready to sell the stock but thought of putting a stop sell to protect my investment return. It turned out the stock sold during the same week. I never looked back even if STX continued to soar later on. I was up 72% besides the dividend payment; it was more than enough for me.
When do I Sell Within My Model
Technically, I don’t’ want to sell stocks in my core portfolio. However, I run my filter each year to make sure my positions still meet my criteria. If a company would start slowing down in terms of sales or earnings, it would gradually move to my sell list. The trigger will happen once I’ve found another company that could fit my core portfolio so I can replace my current holding quickly. Some companies have been picked as my dividend growth addition (such as AAPL) and might end-up in my core portfolio.
A dividend cut is an automatic sell. I would not tolerate any dividend cut in my portfolio as this is often the last resort for a troubled company. I don’t want to sink with a bad management team so I will take my loss and never look back again.
The stop sell is my best selling tool. As I’ve mentioned it before, I like to put a stop sell on riskier stocks showing a healthy profit. It protects my return and makes the decision of selling without involving my emotions during that day. Most of the time, I realize the stop sell went through the day after the sale. By putting the order through my broker account, I avoid the risk of “giving a second chance” to a stock on a losing trend.
Number of Transactions per Year
My dividend growth model doesn’t imply many transactions per month. In fact, I usually make about 5 to 8 transactions per year as I’m still building my own portfolio. My DSR portfolios will likely include less transactions than that. I don’t believe in actively trading dividend stocks as you pass by their most attractive asset: dividend payout growth! However, it is reasonable to think that all portfolios will go through 2 to 5 transactions per year depending on the size (25K vs 100K vs 500K). On the other hand, you never know what could happen and this is why the number of transactions may vary greatly.
Final Thoughts on my Dividend Growth Model
As you can see, my model is not overly complicated as I follow a simple but effective set of rules to build my core portfolio. I trust my instincts to pick my dividend growth stocks additions. I’ve taken two years to implement this model and another two to test it with my own portfolio. So far, I’ve very pleased with the results and believe it will continue to work well in the future. This model enables me to not spend all of my weekend on my portfolio to provide strong results. As the image of my Dividend Stocks Rock website it’s simple but effective. The 12 DSR portfolios are managed based on my experience and inspired by my own dividend growth model.
Register to DSR to see my dividend growth portfolios.
Feel free to ask me any questions!

